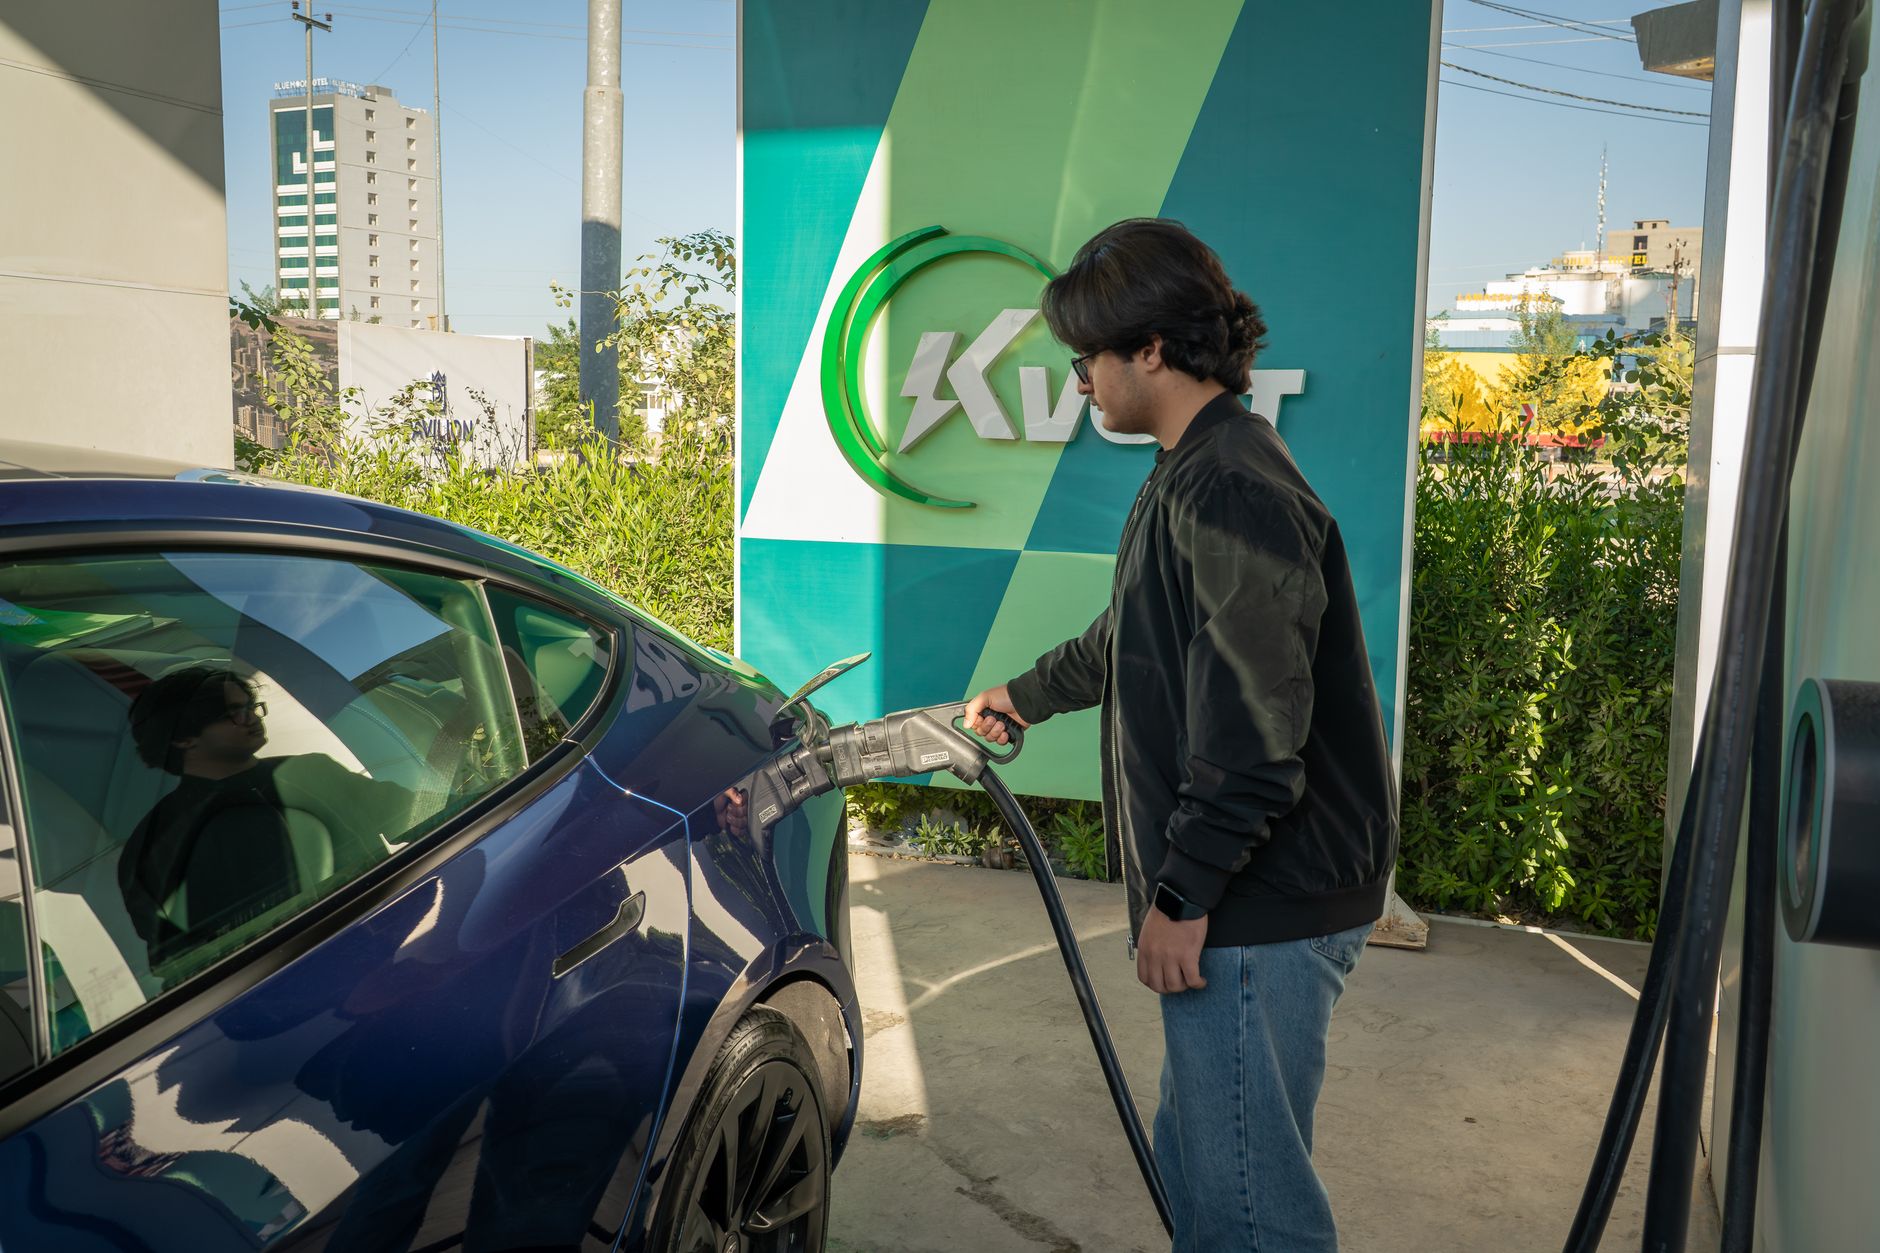
Tesla reported delivery of 486,532 vehicles in the third quarter, marking a 2 % year‑on‑year decline while still landing above analyst forecasts.
Key Takeaways
- Third‑quarter deliveries topped analyst expectations.
- Volume slipped modestly compared with the same period last year.
- The result underscores Tesla’s resilience amid market headwinds.
| Metric | Value | Why it matters |
|---|---|---|
| Q3 vehicle deliveries | 486,532 | Shows the scale of Tesla’s production output. |
| Year‑on‑year change | ‑2 % | Indicates a slight slowdown relative to the prior year. |
| Analyst consensus | Above forecasts | Signals market confidence despite the dip. |
Delivery numbers and year‑on‑year comparison
The 486,532 units shipped in Q3 represent the latest data point in Tesla’s quarterly cadence. Compared with the same quarter a year earlier, the figure is 2 % lower, a modest contraction that reflects the natural ebb and flow of automotive cycles.
Analyst expectations versus actual performance
Industry analysts had projected a shortfall for the quarter, yet Tesla’s actual deliveries exceeded those consensus estimates. This outperformance suggests that the company’s operational execution remains robust enough to beat market sentiment.
Implications for production strategy
A 2 % YoY dip, while modest, prompts a closer look at Tesla’s manufacturing footprint. The company’s ability to deliver nearly half a million vehicles despite a slight slowdown hints at flexible capacity management, likely leveraging its Gigafactory network and advanced automation.
Market reaction and investor sentiment
Beating forecasts typically fuels positive sentiment among investors, even when absolute volumes dip. The result reinforces confidence that Tesla can sustain momentum in a competitive EV landscape, where supply chain resilience and software integration are critical differentiators.
Context: Recent trends in EV deliveries
While the broader electric‑vehicle market has seen rapid growth, Tesla’s performance this quarter illustrates that scale does not always translate into year‑over‑year growth. Seasonal factors, regional demand shifts, and the rollout of new models can all temper growth rates without undermining overall market positioning.
Why it matters
Understanding the nuance between raw delivery counts and analyst expectations helps stakeholders gauge Tesla’s operational health. A delivery figure that exceeds forecasts, even when lower than the prior year, signals that the company’s execution and demand fundamentals remain strong, which is vital for supply‑chain partners, investors, and competitors alike.
Frequently asked questions
What was Tesla’s vehicle delivery count in Q3?
Tesla delivered 486,532 vehicles during the third quarter.
How did the Q3 deliveries compare to the same period last year?
Deliveries were 2 % lower year‑on‑year.
Did Tesla meet analyst expectations for Q3 deliveries?
Yes, the company’s deliveries were above analyst forecasts.
What factors could explain the year‑on‑year decline?
Seasonal demand variations, supply‑chain constraints, and the timing of new model introductions can all influence quarterly delivery trends.
What should investors watch moving forward?
Future quarterly results, especially the fourth quarter, will reveal whether the slight YoY dip is an isolated fluctuation or the start of a broader trend.
Bottom Line
Tesla’s Q3 delivery total of 486,532 units fell 2 % from a year earlier but still outpaced analyst expectations, underscoring the company’s capacity to deliver strong results even amid modest volume headwinds.
We will monitor the upcoming quarter to see if the delivery trajectory rebounds or steadies.
Reporting based on: original source.
Comments
Post a Comment